Men's apparel brand on Flipkart, built from scratch at 20.
Brand identity · Social creatives · Photography · Listings · Packaging · Operations
155 orders · ₹1.13L revenue · FY 2020–22
Not a class project. A real business with real losses — and the most honest design education money can buy.
155
Total Orders
Over 24 months
₹1.13L
Total Revenue
FY 2020–22
49.68%
Return Rate
2–3× industry average
33.2%
Loss Recovered
Via SPF claims
Nearly 1 in 2 orders returned. Industry average is 20–30%. Root causes: courier damage + sizing mismatch. Not one problem — a system problem.
42% of eligible SPF claims were never filed. Incomplete docs, late filing, missing photos. Money lost not from logistics — from process gaps I controlled.
Revenue − Returns = −₹6,238. Add operational costs and the real loss was closer to −₹40,000 to −₹45,000. A design flaw in accounting.
Of 95 returns, only 43 were courier damage. 52 were quality or sizing issues — entirely within my control. Better size charts and QC would have stopped most of them.
Smaller cities: 60%+ of returns vs ~40% of revenue. Informal couriers, poor last-mile, longer transit. Mostly outside my control.
Claim approval: 75.7% → 57.1% between FY21–22. Tracked directly with inconsistent documentation — a process failure, not logistics.
A beautiful listing can't save a product that arrives damaged. Packaging, size chart clarity, and photography angles are operational decisions. I now design with fulfilment in mind.
Brand SystemsRejected SPF claims taught me that process design is as critical as visual design. Missing photos, late filing — these are information design failures.
Process DesignRevenue − Returns is not profit. True cost visibility — shipping, handling, restocking — is what separates sustainable from not. I never present work without understanding the numbers.
Business ThinkingTier 2/3 logistics were outside my control. Quality, sizing info, photography, claim filing — weren't. Separating controllable from uncontrollable is the first step to real improvement.
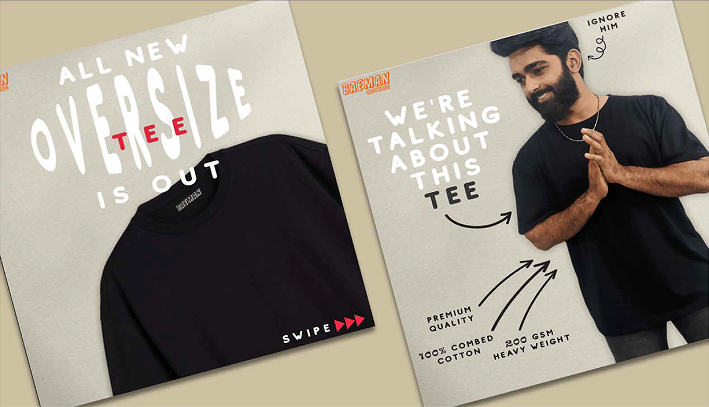
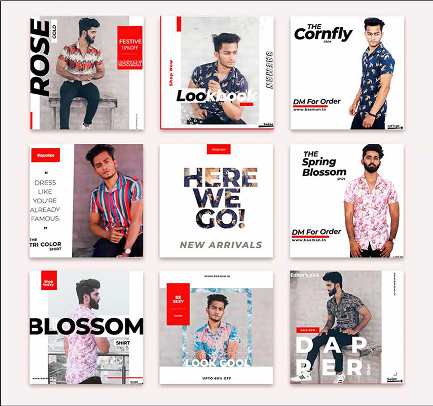
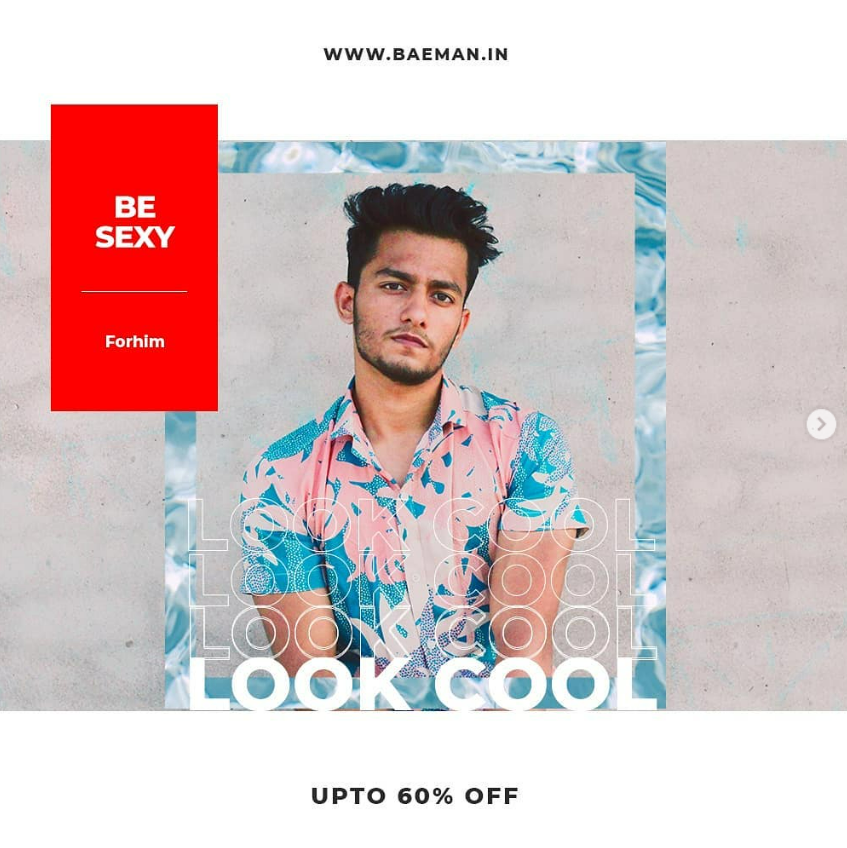
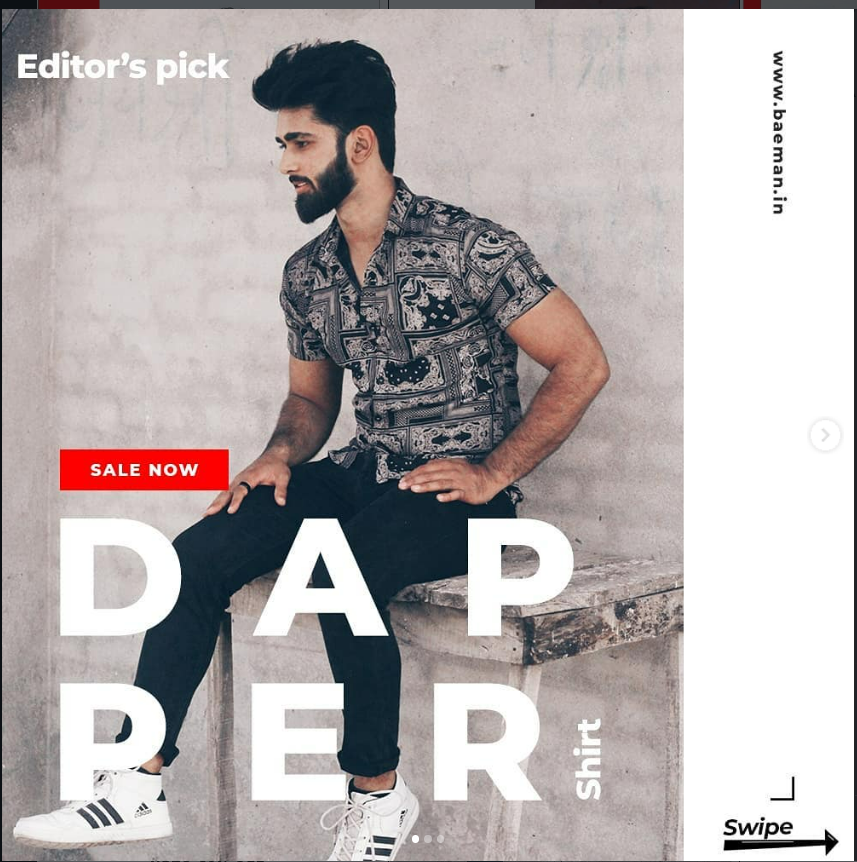
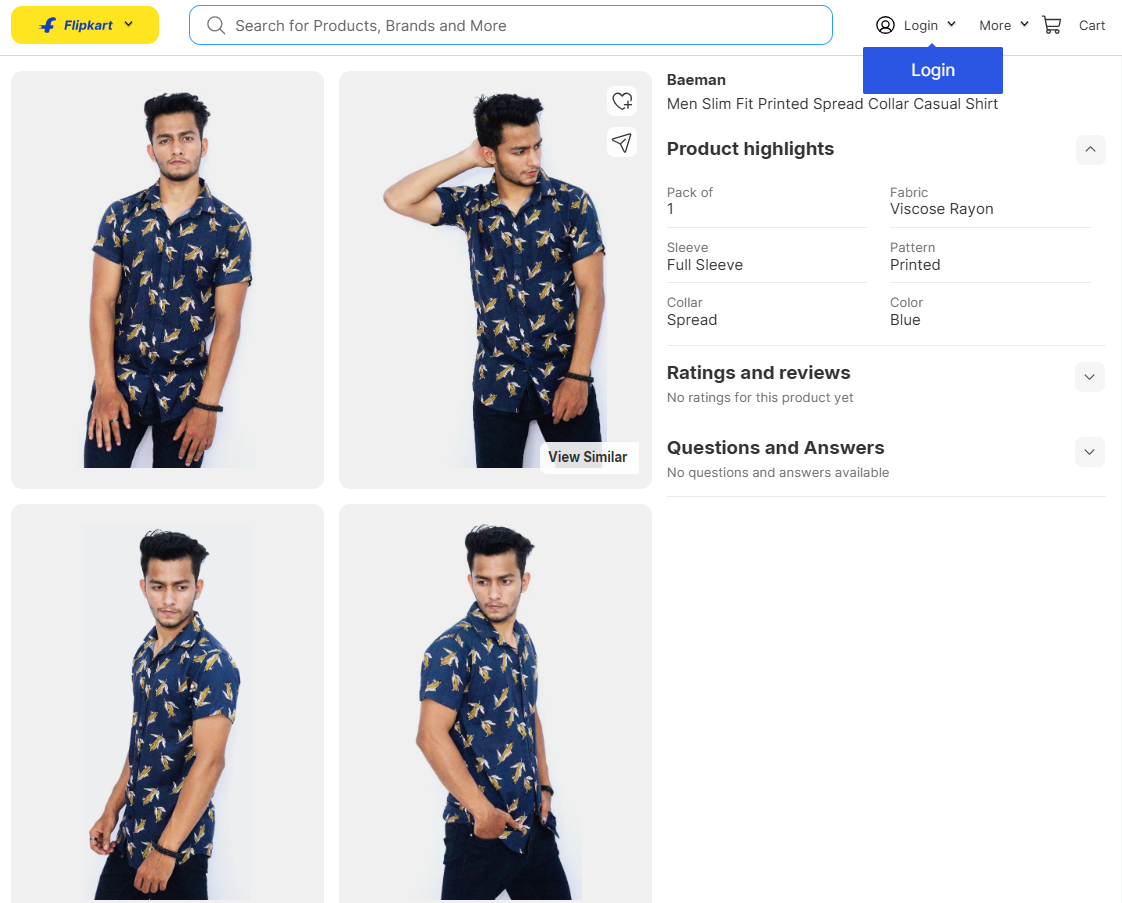
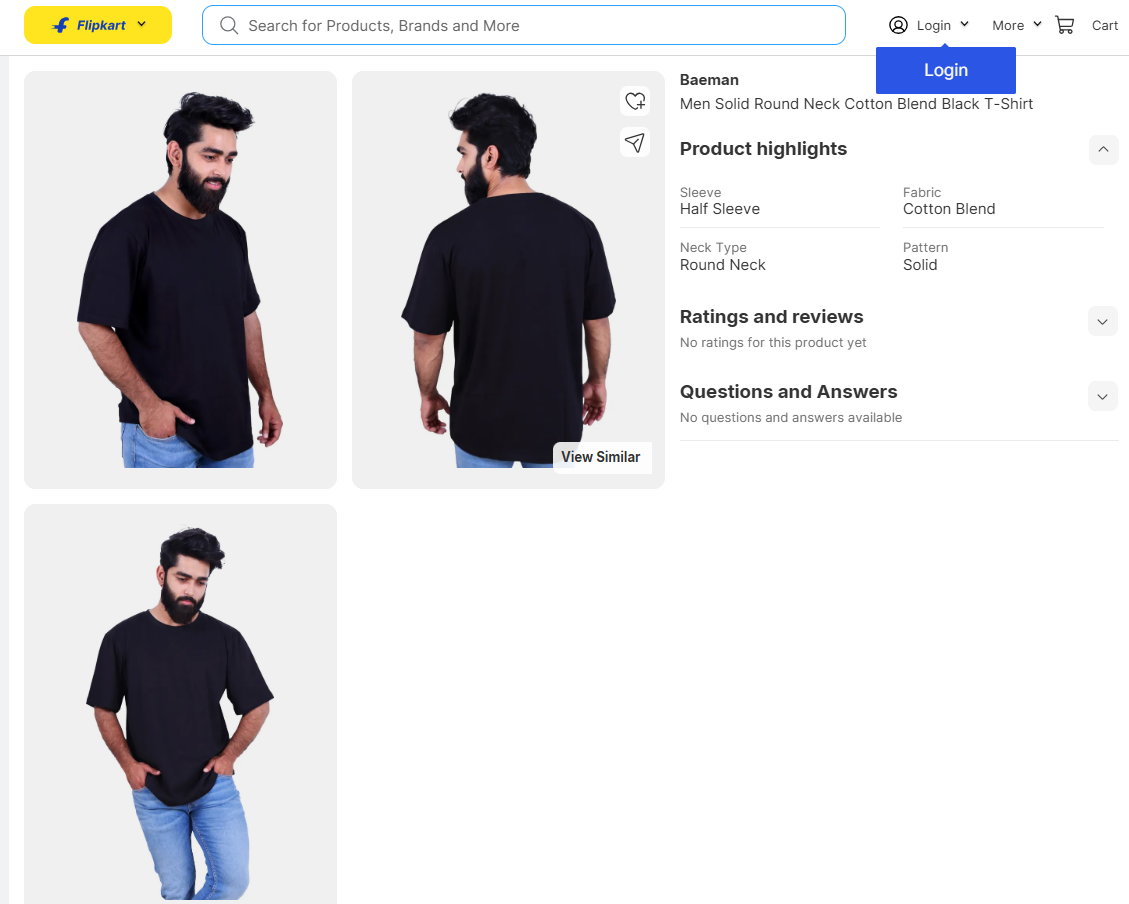
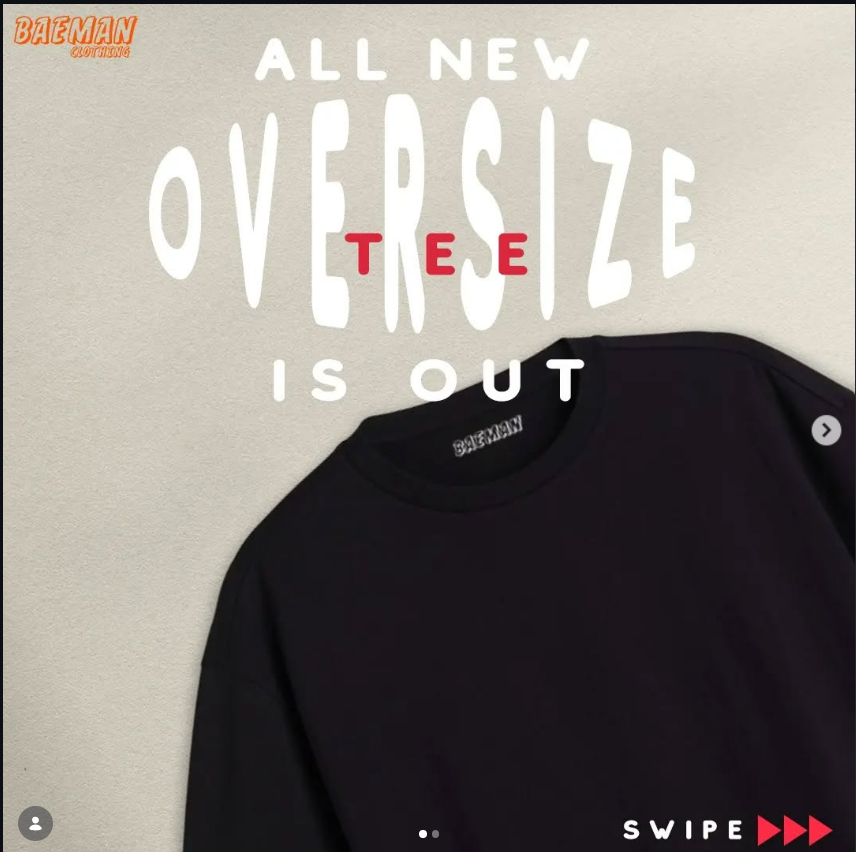
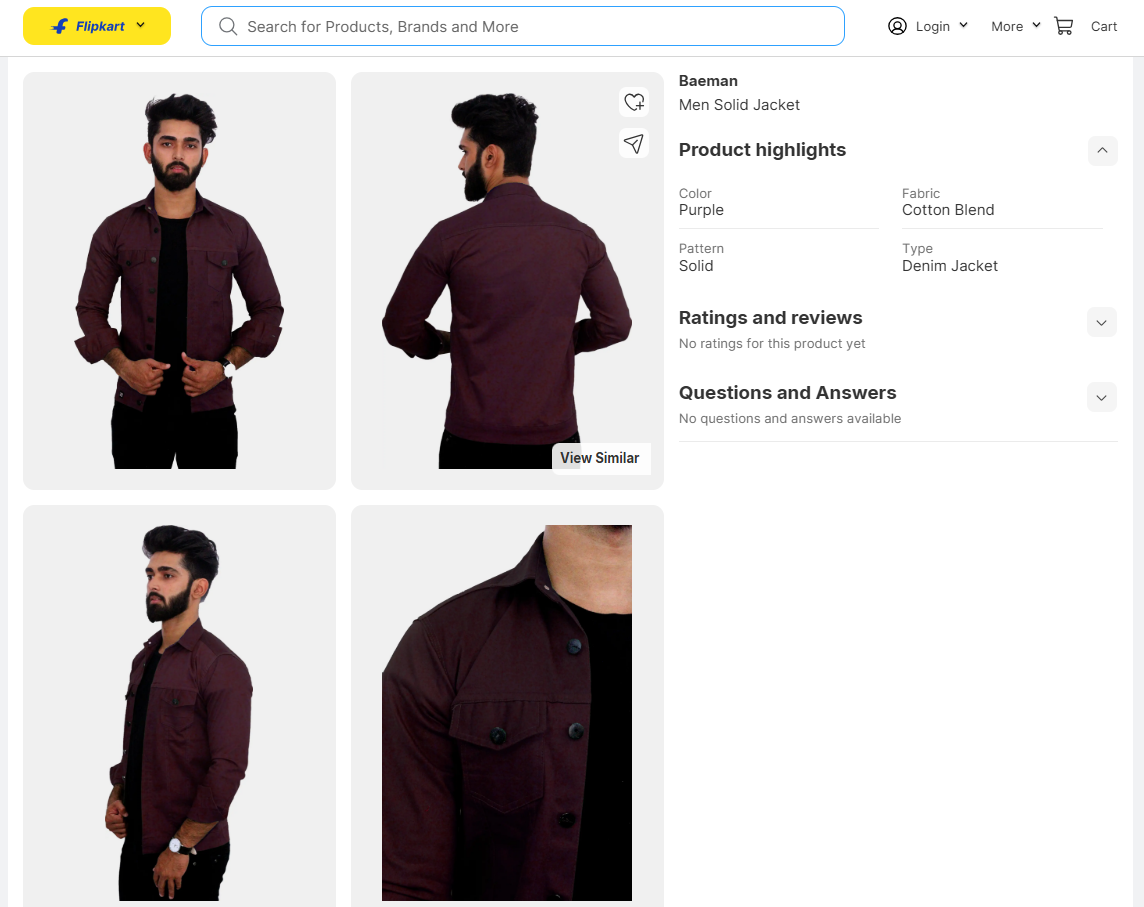
Strategic ThinkingThe Instagram grid and Flipkart listing images were sales tools. I built a visual language that communicated quality before the customer read a word.
Visual StrategyNo data. No team. No precedent. That discomfort is the best design education. I bring founder-level empathy to every brand brief — I've been in that chair.
Founder Mindset- Create SPF claims documentation checklist
- Set up Claims Manager role & Drive structure
- Begin pre-dispatch package photography
- File all pending courier return claims
- Product quality audit — identify problem SKUs
- Create true cost tracking spreadsheet
- Upgrade packaging — bubble wrap + corrugated
- Premium couriers for Tier 2/3 orders
- Add size charts + fitting notes to all listings
- Damage prevention customer communication
- Review quality metrics on new SKUs
- Build return rate dashboard
- Analyse 60-day data for patterns
- Calculate ROI on premium courier investment
- Document all improvements for scaling
- Refine QC process based on learnings
- Final SPF claim process optimisation
- Set targets for the next 90 days
Recovery
₹40K–55K
Having run Baeman end-to-end means I know what a 49% return rate feels like. I bring that weight to every design decision.
Packaging design, listing photography, size chart layout — these aren't aesthetic choices, they're revenue decisions. I design both.
When a client says "I need this to convert", I don't just hear a design problem. I hear someone trying to keep their business alive. That changes how I show up.
₹30K in losses over 24 months is the most efficient education money can buy. Every mistake has a number — that's how I know it was real.